Visualize Project Data
If the user needs to visualize the recorded and processed project data in 1D, 2D or 3D the Visualize Project Data functions will need to be used.
Select the "Visualize Project Data" option from the Project Data menu. The full menu can be seen by left swiping the Project data options bar. Right swiping will close the full option menu.


To view the 1D of any project point with processed data available, select the 1D tab. Under the View Tab, select a point to view in the Select point list.

Then select a data set to view for that point. There are 27 possible data sets available.

When the data set is selected, press the "OK" button then render the image by selecting the render option and the data set will be shown in the chart view.

Render Data
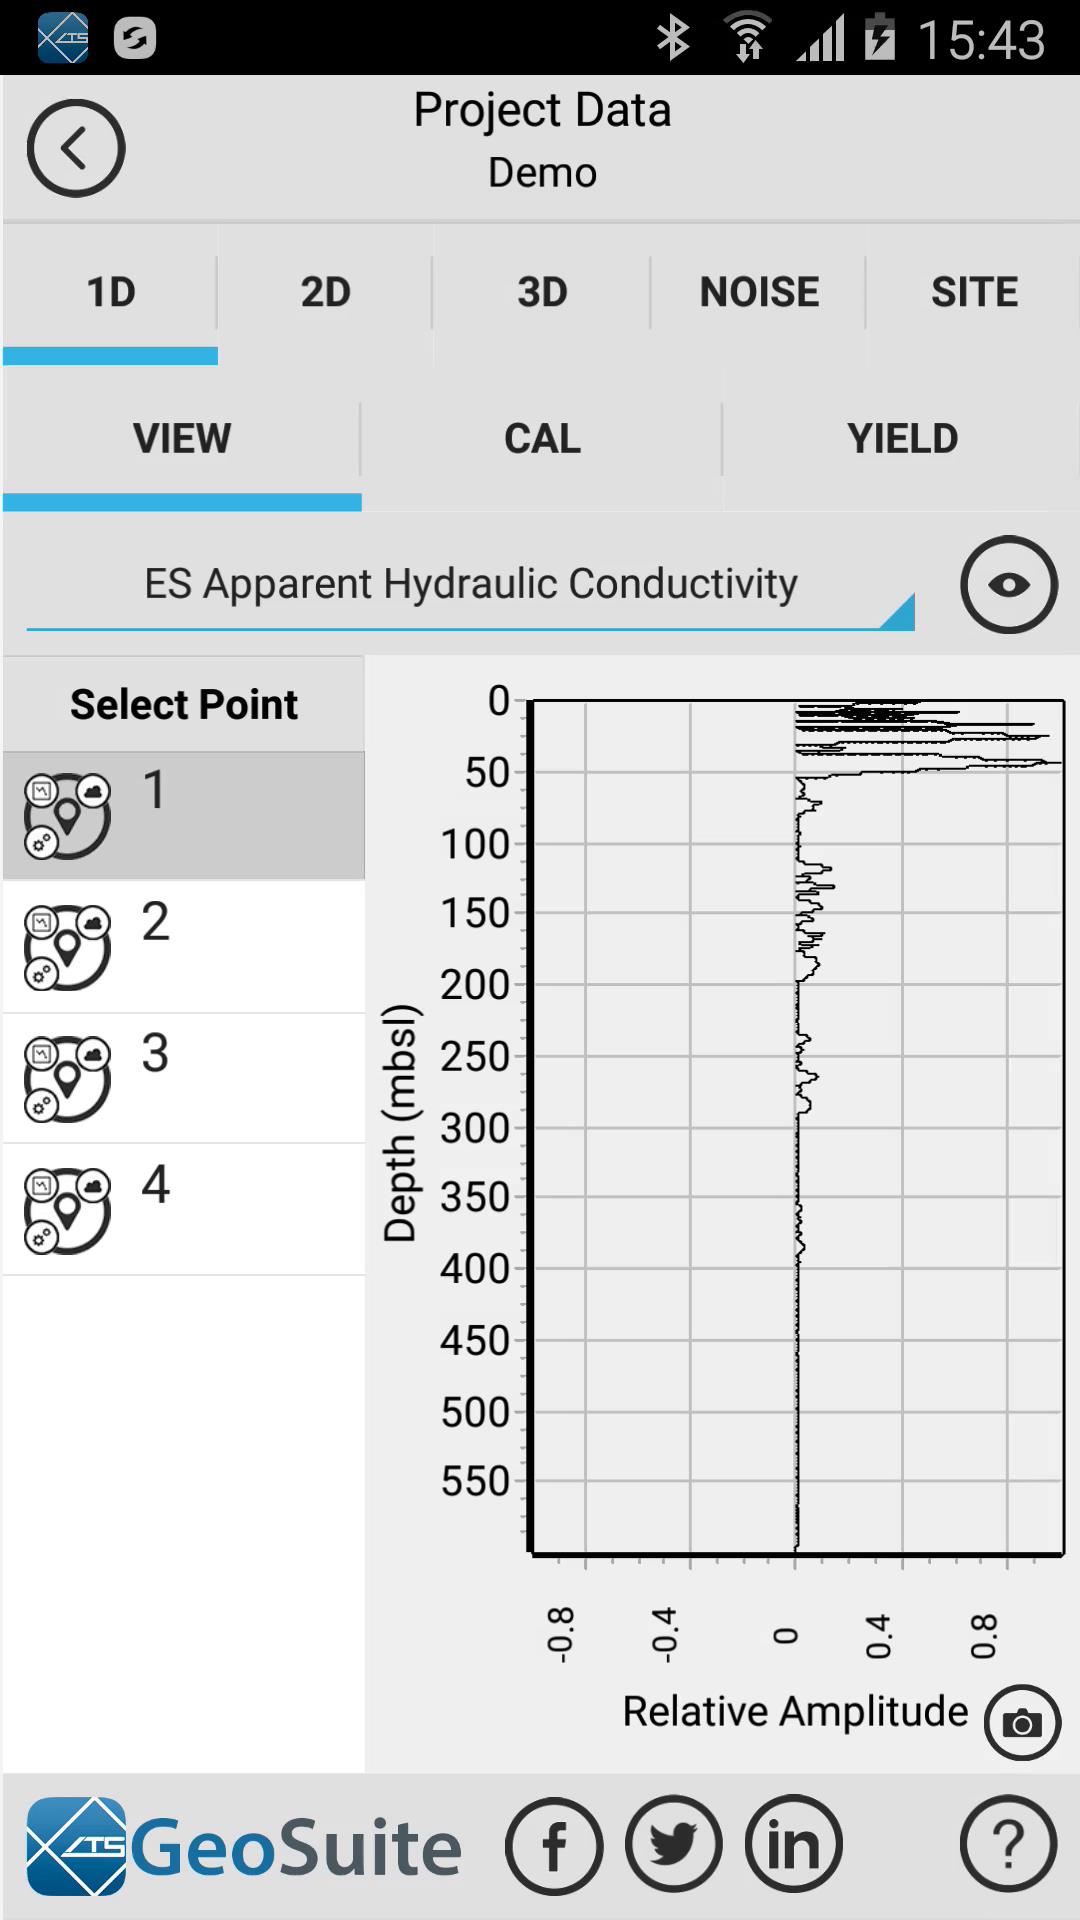

To take a snapshot of the 1D chart select the snapshot option on the chart. One selected, a PDF document containing an image of the current chart will be saved to the Documents folder on the device. A snapshot option exists on the 2D and 3D chart as well

Render button
To view 2D data for a set of project points, select the 2D tab. Under the setup tab, select the project points, in order of position, in the Select Data point list. Select a data set which you want to view for the points, 27 possible data sets are available. The user may use the default interpolation, contouring, depth, elevation correction and color scheme settings or modify them to personalized settings. If calibration data is available, this may also be applied by selecting the calibration point to apply Once done, select the render button.

Once the data has rendered, select the View tab to see the resultant 2D data set.

To visualize project point data in 3D, select the 3D tab.

Generate Gridding Data
The 3D render engine requires gridding of the data to be performed before any data can be visualized in 3D. To do this, select the gridding tab. Select the point which are to be included in the gridding data set, under the Project Points list. If a calibration data set is to be added, select the calibration point to apply to the gridding data under the Calibration Points list. The user may use the default interpolation, elevation correction and gridding depth settings to generate the gridding data set. Or the user may choose to customize these settings. Lastly select the data sets which you would like to generate gridding data for. There are 27 data sets available for gridding.
Once all the options and settings have been completed, select the Generate Gridding Data button to generate the gridding data files.


Render Model Data
Once the Gridding data has been created, the data sets generated can be visualized in 3D. to do this select the Render tab. Under the Select Data Sets to Render list, select the data sets you would like to include in the 3D model. To modify the default data set variables select the data set you wish to modify in the Select Data Sets to Render list, the current values will show in the Render Model data section. The user may use the default values or change the ISO-surface value, color, transparency and border view settings. To save the changes to the data set settings press the refresh button.
To render the 3D model, click on the Render Model Data button.

Once the 3D model data has rendered, select the Model tab to view the rendered 3D Model. The model is interactive and can be rotated and zoomed.

To Visualize the noise and quality control statistics data collected for a project in 2D, select the "Noise" Tab.

Now select the Noise or Quality control data set you want to render.

Now render and view the data.

To visualize site specific 2D data such as site elevation, magnetic data or soil resistivity data, select the "Site" tab.
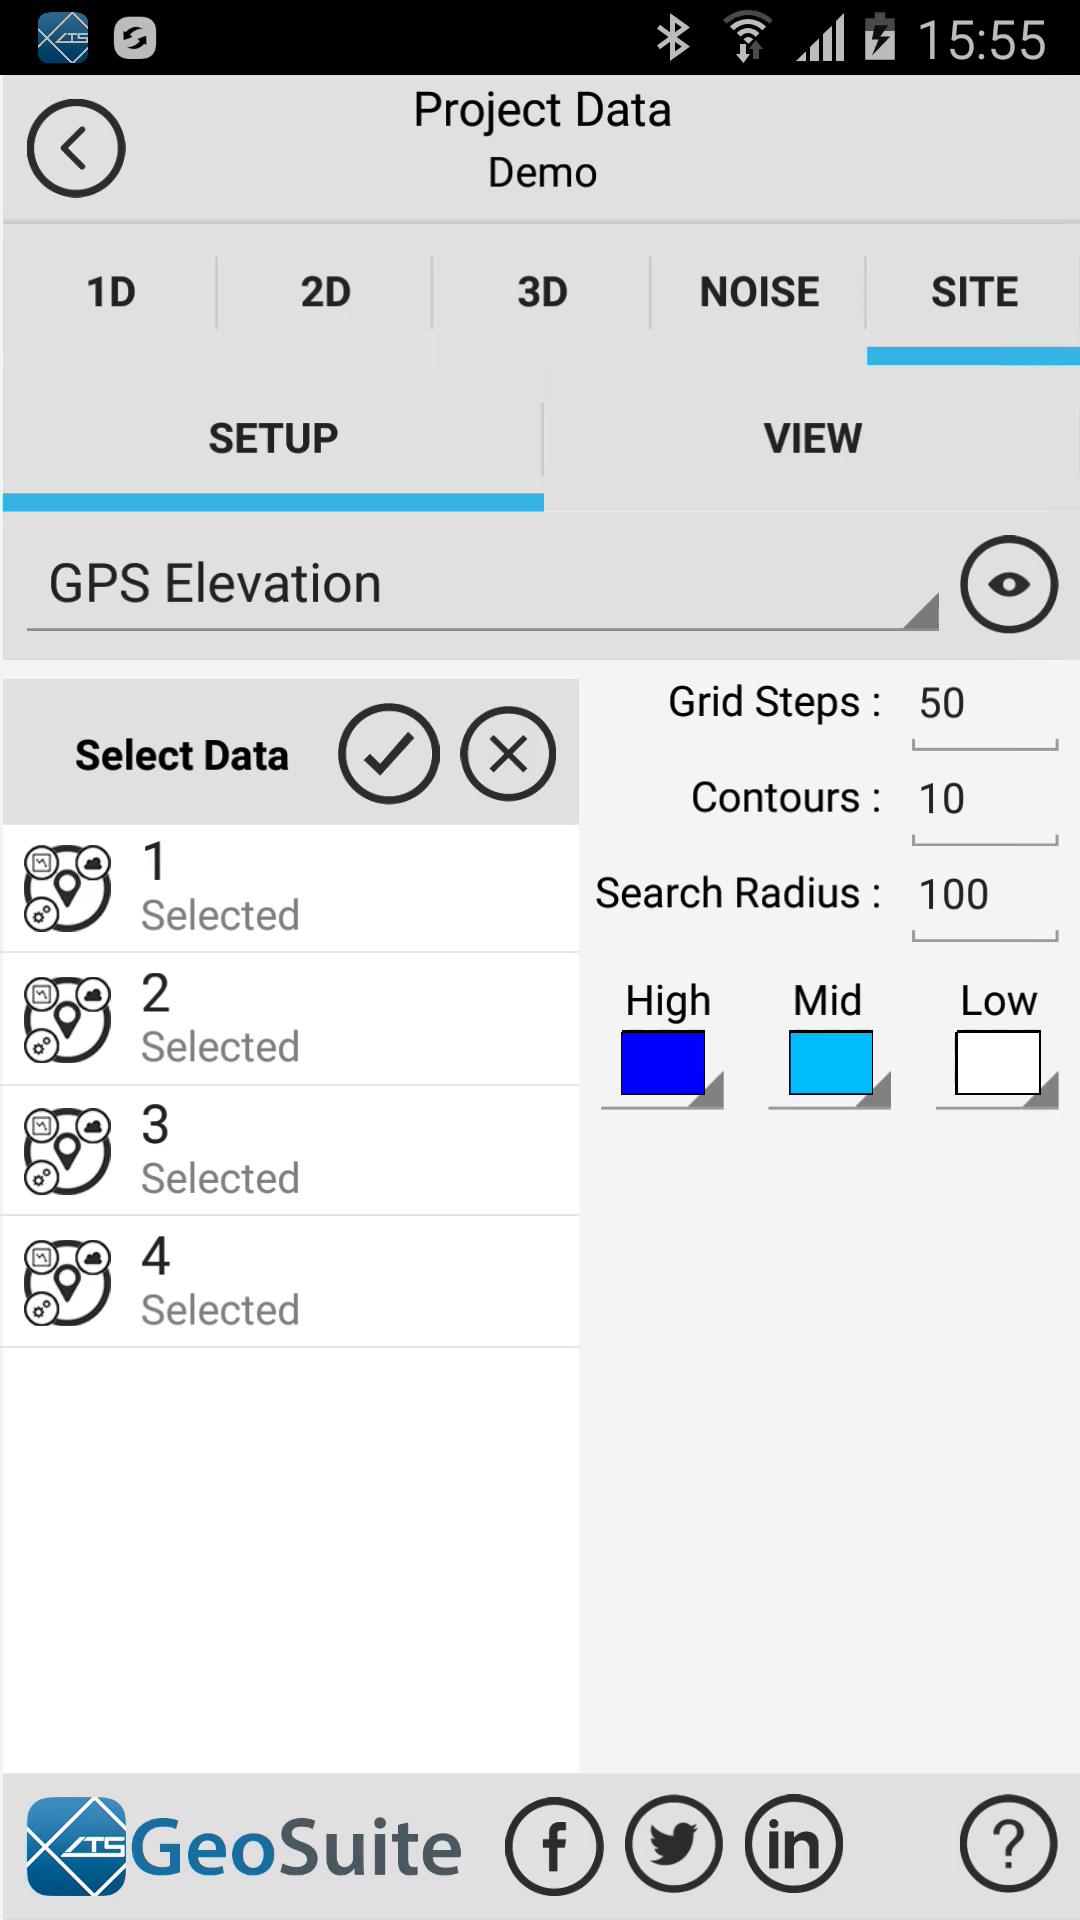
Select the data set you wish to render.

Then select the render option and view.
