
Quality Control
Synopsis
The GeoSuite App has 17 Quality control features built in that assist the user in defining point and project risks. These include:
1) Actual strikes of the base plate in the field;
2) Strikes detected by the strike detection algorithms;
3) False strikes delineated by the strike detection algorithms;
4) Strikes rejected by the correlation algorithms;
5) Strikes used by the correlation algorithms;
6) The correlation index of the summed stack set;
7) The point correlation risk assessment;
8) The pre-filtering fundamental frequency noise level in Volts;
9) The post-filtering fundamental frequency noise level in Volts;
10) The pre-filtering odd harmonic frequency noise level in Volts;
11) The post-filtering odd harmonic frequency noise level in Volts;
12) The pre-filtering even harmonic frequency noise level in Volts;
13) The post-filtering even harmonic frequency noise level in Volts;
14) The pre-filtering high frequency noise level in Volts;
15) The total filter efficiency of the digital filters applied to the point data set;
16) The signal to noise ratio determined after filtering has been applied;
17) The calculated ES sounding risk.
This data is based on the best correlation index achievable with a minimum of 5 stack sets per survey point. If the value is below 50% that point should be considered with caution when used as a recommended drilling location.
Data quality correlation index and site noise description

Strikes Detected
This describes the number of individual seismic source impacts at each sounding location that was detected by the software based trigger algorithm when the data is imported into the software.
False Strikes
At times, environmental and man-made noise sources produce high and low end transient noise spikes which the software based trigger algorithm interprets as an actual recorded seismic source impact. Noise sources such as electric fences and double bounce strikes of the seismic source can cause these false triggers. The software correlation algorithms then detect and filter these false trigger events out of the stack data set.


Strikes Rejected
Additionally, the correlation algorithms identify seismic source impacts which do not correlate well with the group stack set and reject them. The data indicated in Table 3 describes the total number of rejected seismic source impact data sets including the false trigger data and the non-correlating sets.

Correlating Strikes Used
An adaptive correlation algorithm is utilized to determine the best possible stack data set based on a minimum of 50% utilization of the detected seismic source impact events, not including the false data.

Correlation Index
These correlating data sets are evaluated for an inter correlation index to describe the overall quality of the stack data set at a specific location. This correlation index is used to determine the reliability index of the data at a specific sounding location within the model. This helps evaluate if the point data should be considered for exploration or re-evaluation.

Pre-Filter Fundamental frequency Level
The Fundamental frequency of any electrical noise source is described as the lowest frequency of a periodic wave form. In most cases, this periodic noise is generated by induced currents from power systems, such as, power lines and transformers etc.
This data is produced by the frequency analysis of the first second of data recorded on an ES sounding data recording. This data is assumed to be void of any ES data and is merely represented of the background electrical noise around the sounding location. The fundamental frequency is automatically detected by software algorithms to be either 50 or 60Hz. Once the fundamental electrical power noise frequency is determined, the noise level of the fundamental frequency is calculated. The value is displayed as a Root mean square voltage level that is representative of the average fundamental frequency noise content present in the first second of the ES recording. This data classifies which points in an ES project suffer from high electrical noise interference.

Post-Filter Fundamental frequency Level
The Fundamental frequency of any electrical noise source is described as the lowest frequency of a periodic wave form. In most cases, this periodic noise is generated by induced currents from power systems, such as, power lines and transformers etc.
This data is produced by the frequency analysis of the first second of data recorded on an ES sounding data recording after a digital notch filter, set at the fundamental frequency, is applied to the full data set. This first second of data is assumed to be void of any ES data and is merely represented of the filtered background electrical noise around the sounding location. Once the fundamental electrical power noise frequency is filtered out, the resulting noise level of the fundamental frequency is calculated. The value is displayed as a Root mean square voltage level that is representative of the average filtered fundamental frequency noise content present in the first second of the ES recording. This data shows the resultant filtered fundamental frequency level at each ES sounding location and effectively quantifies the suppression of fundamental frequency noise produced by filtering.

Pre-Filter Odd Harmonic frequency Level
The Harmonic of a periodic wave form is described as a frequency at an integer multiple of the fundamental frequency. As such, they are all periodic at the fundamental frequency and so are their sums. Odd harmonic frequencies are the odd integer multiples of a fundamental frequency. If a fundamental frequency (f) is 50Hz then the first odd harmonic will be (3f) or 150Hz and the second odd harmonic will be (5f) or 250Hz and so on. The same is true of even harmonic frequencies where the first even harmonic is (2f) or 100Hz and the second even harmonic is (4f) or 200Hz. These harmonic frequencies can extend to high frequencies but usually decrease in amplitude as frequency increases. In most cases, this periodic noise is generated by induced currents from power systems, such as, power lines and transformers etc.
This data is produced by the frequency analysis of the first second of data recorded on an ES sounding data recording. This data is assumed to be void of any ES data and is merely represented of the background electrical noise around the sounding location. The odd harmonic frequencies are calculated by the odd integer multiplication of the detected fundamental frequency up to a maximum frequency of 1000Hz. The average noise level of the odd harmonics of the fundamental frequency is calculated. The value is displayed as a Root mean square voltage level that is representative of the average odd harmonic frequency noise content present in the first second of the ES recording. This data classifies which points in an ES project suffer from high odd harmonic electrical noise interference.

Post-Filter Odd Harmonic frequency Level
The Harmonic of a periodic wave form is described as a frequency at an integer multiple of the fundamental frequency. As such, they are all periodic at the fundamental frequency and so are there sums. Odd harmonic frequencies are the odd integer multiples of a fundamental frequency. If a fundamental frequency (f) is 50Hz then the first odd harmonic will be (3f) or 150Hz and the second odd harmonic will be (5f) or 250Hz and so on. The same is true of even harmonic frequencies where the first even harmonic is (2f) or 100Hz and the second even harmonic is (4f) or 200Hz. These harmonic frequencies can extend to high frequencies but usually decrease in amplitude as frequency increases. In most cases, this periodic noise is generated by induced currents from power systems, such as, power lines and transformers etc.
This data is produced by the frequency analysis of the first second of data recorded on an ES sounding data set after odd harmonic digital filtering was applied to the entire data set. This first second of data is assumed to be void of any ES data and is merely represented of the filtered background electrical noise around the sounding location. The odd harmonic frequencies are calculated by the odd integer multiplication of the detected fundamental frequency up to a maximum frequency of 1000Hz. The average noise level of the filtered odd harmonics of the fundamental frequency is calculated. The value is displayed as a Root mean square voltage level that is representative of the average odd harmonic frequency noise content present in the first second of the ES recording after filtering of the odd harmonic frequencies. This data classifies which points in an ES project suffer from high odd harmonic Electrical noise interference.

Pre-Filter Even Harmonic frequency Level
The Harmonic of a periodic wave form is described as a frequency at an integer multiple of the fundamental frequency. As such, they are all periodic at the fundamental frequency and so are there sums. Odd harmonic frequencies are the odd integer multiples of a fundamental frequency. If a fundamental frequency (f) is 50Hz then the first odd harmonic will be (3f) or 150Hz and the second odd harmonic will be (5f) or 250Hz and so on. The same is true of even harmonic frequencies where the first even harmonic is (2f) or 100Hz and the second even harmonic is (4f) or 200Hz. These harmonic frequencies can extend to high frequencies but usually decrease in amplitude as frequency increases. In most cases, this periodic noise is generated by induced currents from power systems, such as, power lines and transformers etc.
This data is produced by the frequency analysis of the first second of data recorded on an ES sounding data recording. This data is assumed to be void of any ES data and is merely represented of the background electrical noise around the sounding location. The even harmonic frequencies are calculated by the even integer multiplication of the detected fundamental frequency up to a maximum frequency of 1000Hz. The average noise level of the even harmonics of the fundamental frequency is calculated. The value is displayed as a Root mean square voltage level that is representative of the average even harmonic frequency noise content present in the first second of the ES recording. This data classifies which points in an ES project suffer from high even harmonic Electrical noise interference.

Post-Filter Even Harmonic frequency Level
The Harmonic of a periodic wave form is described as a frequency at an integer multiple of the fundamental frequency. As such, they are all periodic at the fundamental frequency and so are there sums. Odd harmonic frequencies are the odd integer multiples of a fundamental frequency. If a fundamental frequency (f) is 50Hz then the first odd harmonic will be (3f) or 150Hz and the second odd harmonic will be (5f) or 250Hz and so on. The same is true of even harmonic frequencies where the first even harmonic is (2f) or 100Hz and the second even harmonic is (4f) or 200Hz. These harmonic frequencies can extend to high frequencies but usually decrease in amplitude as frequency increases. In most cases, this periodic noise is generated by induced currents from power systems, such as, power lines and transformers etc.
This data is produced by the frequency analysis of the first second of data recorded on an ES sounding data set after even harmonic digital filtering was applied to the entire data set. This first second of data is assumed to be void of any ES data and is merely represented of the filtered background electrical noise around the sounding location. The even harmonic frequencies are calculated by the even integer multiplication of the detected fundamental frequency up to a maximum frequency of 1000Hz. The average noise level of the filtered even harmonics of the fundamental frequency is calculated. The value is displayed as a Root mean square voltage level that is representative of the average even harmonic frequency noise content present in the first second of the ES recording after filtering of the even harmonic frequencies. This data classifies which points in an ES project suffer from high even harmonic Electrical noise interference.
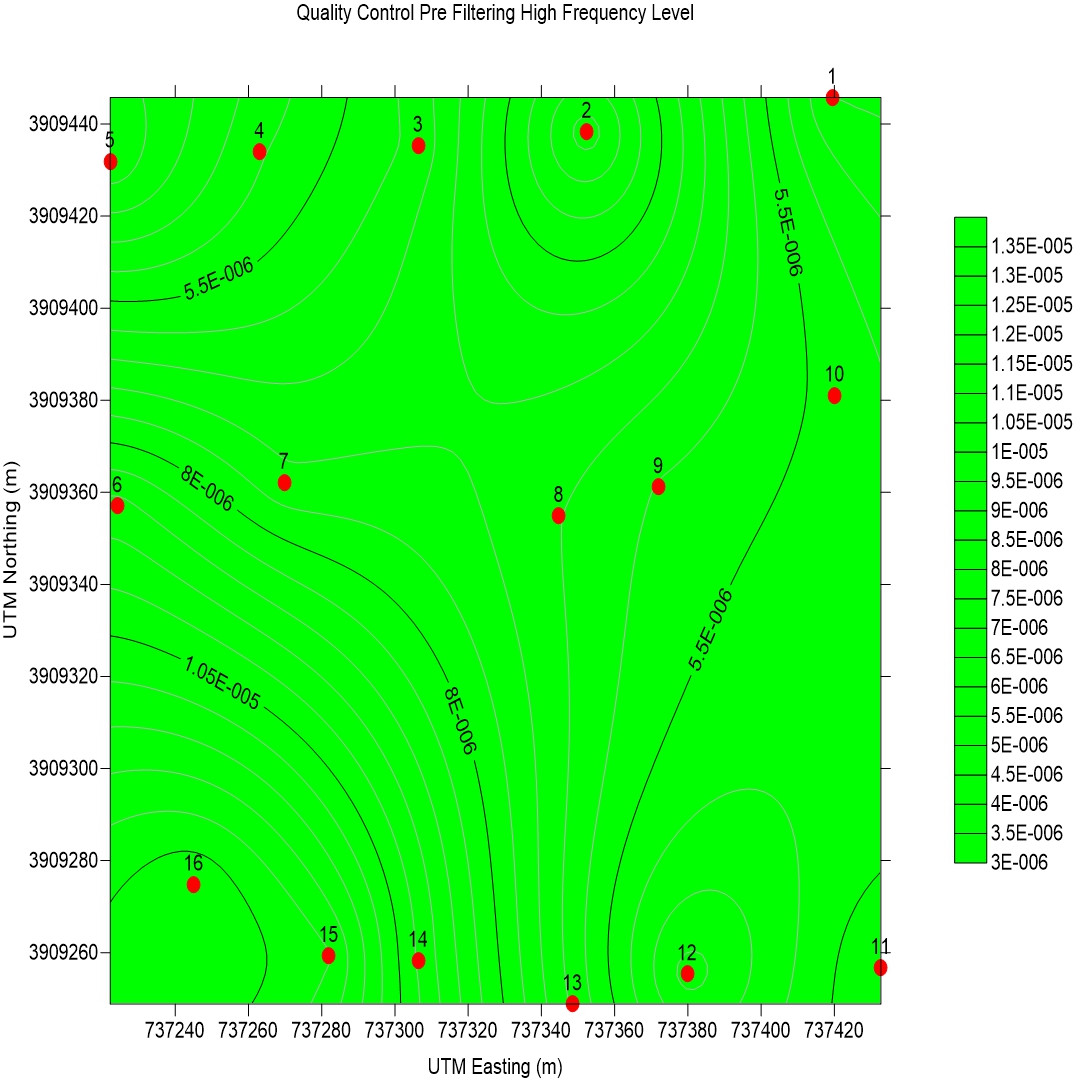
Pre-Filter High frequency Level
High Frequency noise in terms of an ES survey is defined as the noise above a frequency of 1000Hz. High frequency noise is caused by a number of natural and man-made sources, including but not limited to:
1) Electric fences;
2) Lightning;
3) Telephone lines;
4) Communication devices;
5) High frequency seismic sources.
By default, all high frequency noise is filtered out by a 1000Hz digital low pass filter prior to processing. This is done to remove any interference that the high frequency noise may have on the ES data sets. Unfortunately, at times, there is still high frequency noise bleed through caused by exceptionally high amplitude noise sources. It is thus useful to quantify this noise in order to identify potential risk.
The high frequency noise data is the summed average of the noise in the frequency band from 1000Hz to 22050Hz prior to the application of the digital low pass filter. This effectively quantifies the average level of high frequency noise around the ES survey site. The value displayed is a Root mean square voltage level that is representative of the average high frequency noise content present in the first second of the ES recording prior filtering out of the frequencies above 1000Hz. This data is useful at determining if there are any high frequency noise sources present around the ES survey location.

Filter Efficiency Coefficient
In order to determine whether the applied digital filters are effectively filtering out interference produced by any possible noise sources, a filter efficiency coefficient is calculated. This filter efficiency coefficient is calculated by subtracting the frequency domain post filtering data set from the pre-filtering data set and dividing it by the frequency domain data of the pre-filter data set. This effectively determines how effectively the filters have functioned at removing noise interference from the ES data sets. This value is shown in Table 3 and is expressed as a percentage between 0 and 100 percent of filter efficiency.
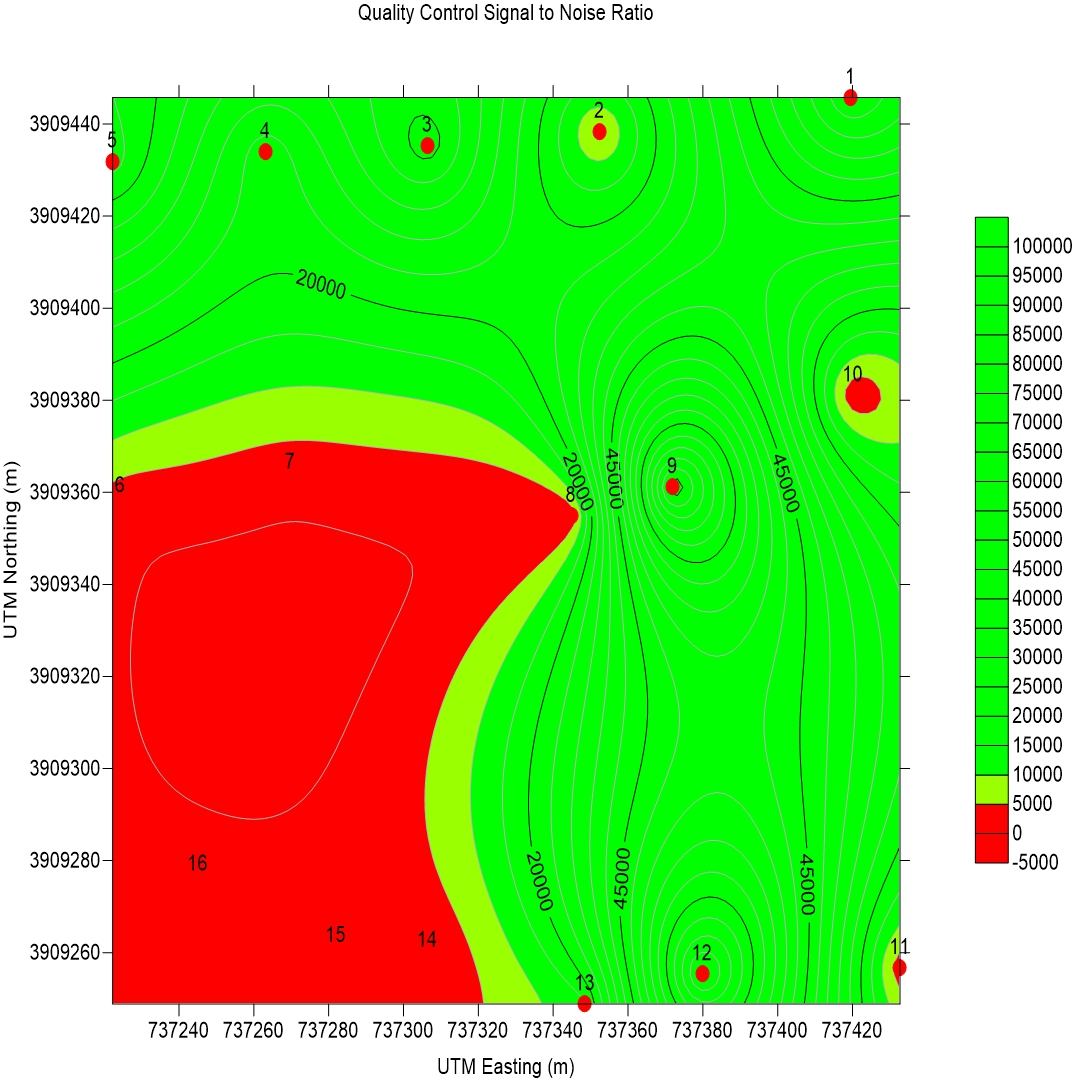
Signal to noise ratio
Signal-to-noise ratio (SNR) is a measure that compares the level of a desired signal to the level of background noise. It is defined as the ratio of signal power to the noise power.
The signal to noise ratio for each sounding data set is calculated by summing the peak power of the individual detected seismic source induced ES responses in volts, which have been selected by the correlation algorithms for use in the stack. This value is then divided by the number of used strikes to determine the average ES response peak value. The noise floor is then determined by the summation of the frequency domain data divided by the number of frequency bins used. The Signal to noise ratio is then calculated by dividing the Average peak ES response data by the calculated average noise floor level.

Calculated Point Noise Risk
The calculated point noise risk is empirically determined by an experiential quantification of acceptable SNR levels in ES surveys. This value is representative of the risk that the filtered noise within the ES data set has to the data set. The higher the risk level, the lower the quality the overall ES data has and the lower the ES data set reliability is.

Calculated Total ES Sounding Risk
This variable provides a final risk assessment of the quality of the data at any particular sounding location, including the correlation index and noise risk data for each point.
It is calculated by multiplying the correlation index of the stack set data at a sounding location by the calculated electrical noise risk at the same location. This risk coefficient is then displayed as a risk percentage. This data is an indication of the reliability of the recorded ES data and can be used to determine data quality at any particular ES sounding location.
Average project data quality and correlation index
The GeoSuite App also calculates the overall project and project model quality and reliability. The most important values are the average correlation index data and the average calculated point noise risk data and the Average Calculate Total ES Sounding risk data.
The average correlation index describes the average correlation index of the project points in a project. This gives an indication as to the quality of the actual ES response data with regard to phase and amplitude. This is a very important measure of quality of the ES data itself. Values above 0.8 are considered to be very good. Values below 0.5 are considered poor.
The average calculated point noise risk is also very important as it defines the risk placed on the model by noise interference. If this value is below 50% it is considered acceptable.
The Average Calculate Total ES Sounding risk is the most important value in Table 3, as it describes the combined values of the average correlation index and the average calculated point noise risk in terms of overall model quality. If this value is smaller than 50% then the model is considered to be of acceptable quality and reliability.