
Example project - Groundwater Study, South Africa

Designed Grid Layout
Project Objectives
The objectives for the electro-seismic survey trial this project site is as follows:
1) Define the aquifer systems under the site
2) Define the primary permeability of the aquifers under the site
3) Define secondary permeability of the aquifers under the site
4) Define any possible structures, such as dykes, faults and sills that may affect the hydro-geology of the site
5) Define any secondary permeability caused by such faulting or intrusive formations
6) Define any possible saline groundwater reserves under the site
7) Define groundwater resource potential
8) Recommend a drilling strategy
Site Description
The investigation site, located on the farm named ‘Pataga’ near Hayden SA, was chosen by the client to evaluate the ATS electro-seismic geophysical method at delineating sub-surface aquifer structures. The investigation site chosen covers an area of one square kilometre and is orientated in a North to South direction.
A total of 121 electro-seismic sounding points where surveyed at an inter point grid spacing of 100m. This grid spacing was chosen to give a low resolution overview of the sites hydrological structures and parameters. The site had variable surface soil types with a great deal of screat. The geological formations under the site consist mostly of Karoo formations overlying a shale sill which in turn overlays a quartzite basement. The formations dip at an angle of 12 degrees from the South to the North of the site.
There is a major fault line one kilometre to the north of the site indicating a hydrological drain boundary. The site is also known to have dolerite dyke and sill formations that run along and intersect the site.
Model Calibration
Due to the presence of a dipping plain for all the formations under the site, calibration of the ES data using the geological well logs presented a variation of 10% in seismic velocity at the three calibrations locations on the site. This variation is caused by changes in the vertical rock type structures that naturally vary from the South of the site to the North of the site. As such, it was decided to take an average velocity for the site and apply it to the seismic velocity profile for the entire investigation site model. A velocity of 2000m/s second was chosen. This may result in depth estimation variations of up to 10% of the total investigation depth. This variation can be improved by utilizing additional geological logs within the investigation to calibrate the seismic velocity profile of the ES model more accurately.

Primary Permeability

Secondary Permeability
Vertical Structure
Saline aquifers in relation to fresh water aquifers

Groundwater resource potential

Interfactial responses
Discussion of results
Primary Permeability
• Primary permeability is dependent on both depth and formation.
• Upper Karoo formations have hydraulic conductivities ranging from 0.01 to 0.08 m/day at depths ranging from 0m to 100m.
• Karoo Formations from 100m to 250m depth have hydraulic conductivities ranging from 0.005 to 0.01 m/day.
• The coal bed formations have very low permeability's ranging from 0.002m 0.01 m/day at depths from 150m to 300m.
• The coal bed formations have very low permeability's ranging from 0.001m 0.003 m/day at depths from 300m to 480m.
• Formations below the coal seam have primary permeability's with hydraulic conductivities < 0.001m/day.
• Primary permeability's are enhanced along vertical structures to depths of 650m.
• Primary permeability's around these vertical structures vary between 0.005 to 0.05 m/day in hydraulic conductivities.
• There is a low primary permeability formation between 100m and 160m depth.
• There is a low primary permeability area in the upper Karoo formations that have hydraulic conductivitiesranging from 0.001 to 0.005 m/day.
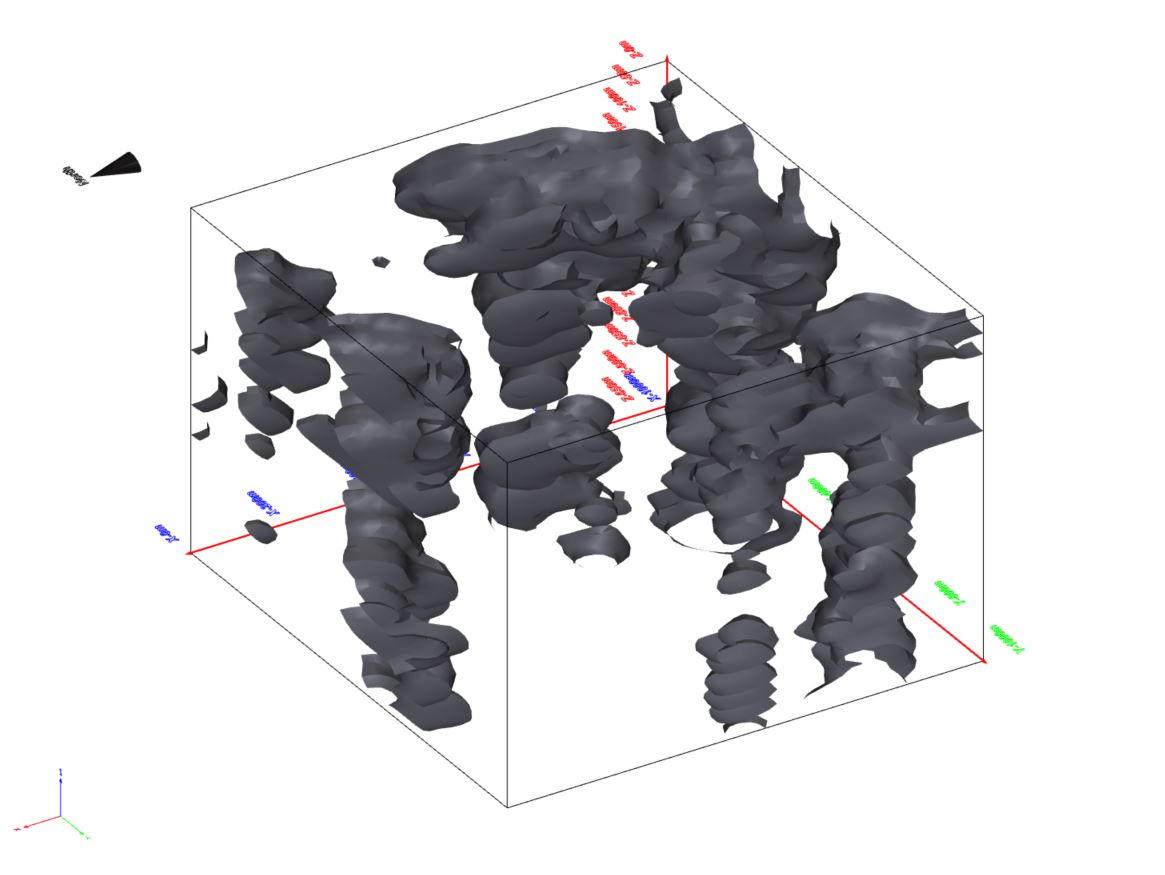
Secondary Permeability
• ES methods can only detect sub vertical fracturing to an angle of 30 degrees.
• The fracturing under the site is well developed, indicating that primary groundwater flow is mostly facilitated by secondary permeability.
• This low primary permeability indicates that there is minimal groundwater storage capacity under the site as most of the groundwater reserves are located within the secondary permeability structures.
• There is a significant amount of fracturing to the south and to the north of the site.
• This fracturing extends to a depth of 650m, implying that it is caused by vertical structures under the site such as faulting.
• Horizontal fracturing in the shale seam is extensive to the south of the site and rapidly decreases as the shale seam depth increases to the north of the site.
• This may be due to overburden compression closing the existing horizontal fracture networks within the shale sill.
• Since the primary porosity within the shale seam is very low, secondary permeability fracturing must be targeted to mine the aquifer.
• The highly fractured zones to the north and to the south of the site may be used to facilitate the mining of the up gradient aquifers.
Vertical Structure analysis
• The algorithm detects slight variations in interface depth and includes secondary permeability created by high density horizontal fracturing to detect vertical faulting or intrusive formation
• There are three definable vertical structures under the site. These structures are thought to be fault lines due to the high degree of fracturing around the structures.
• There is one vertical structure in the north east corner of the site which may be an intrusive dyke formation due to the high primary permeability it induces but shows a lack of fracturing.
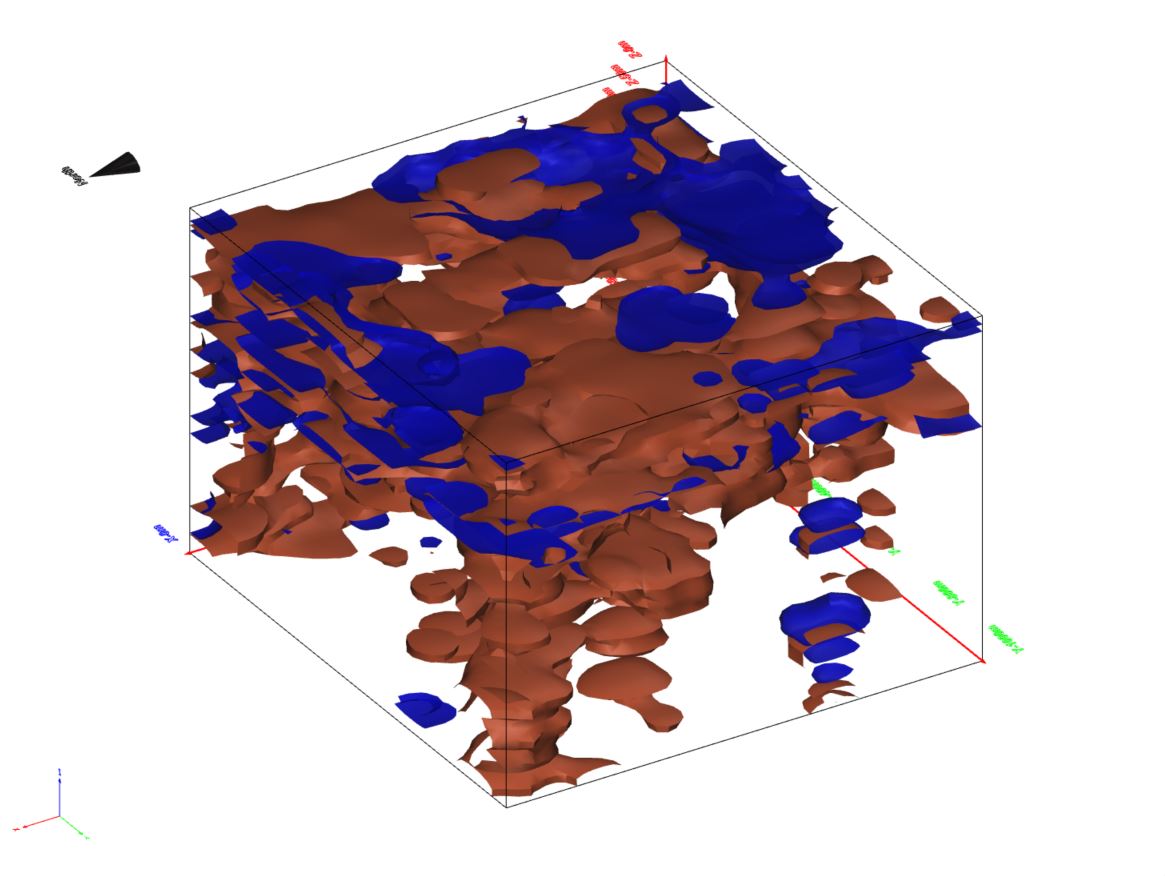
Potential saline aquifer analysis
• The data indicates that the majority of the aquifers under the investigation site are saline
• The saline groundwater also seems to have permeated along the vertical structures to greater depths however it does not seem to have spread at depth. This may be due to the very low permeability's of the structures under the shale formation
• The low primary permeability areas in the upper aquifers appears to be higher in salinity than the higher permeability areas.
Groundwater Resource Potential
• The southern half of the investigation site appears to be capable of mining to a depth of 300m.
• The northern half of the test site has far lower permeability at depth and will require well development to mine.
• There appears to be a natural high permeability area at depth at the very northern border of the site. This may assist mine of the shale seam formation which is low in permeability
Recommendations
• Due the lack of high primary permeability formations under the site it is recommended to use the natural secondary permeability structures running through the site to mine the site.
• The vertical structures run that across the site in an West to East direction, present a large natural groundwater drain surface area with high secondary permeability.
• It is recommended to use these natural vertical structures as a base to develop extraction wells in.
• Well development may be required in the north to central section of the site as this area has very low primary and secondary permeability.