Acquire Point Data
If the user needs to acquire geophysical field data at a given location in the field, the Acquire Field Data function can be used. This can be done in one of two ways. If the project point has already been created and is shown in the Project Data list, select the point of interest on the list.


Clear Selection
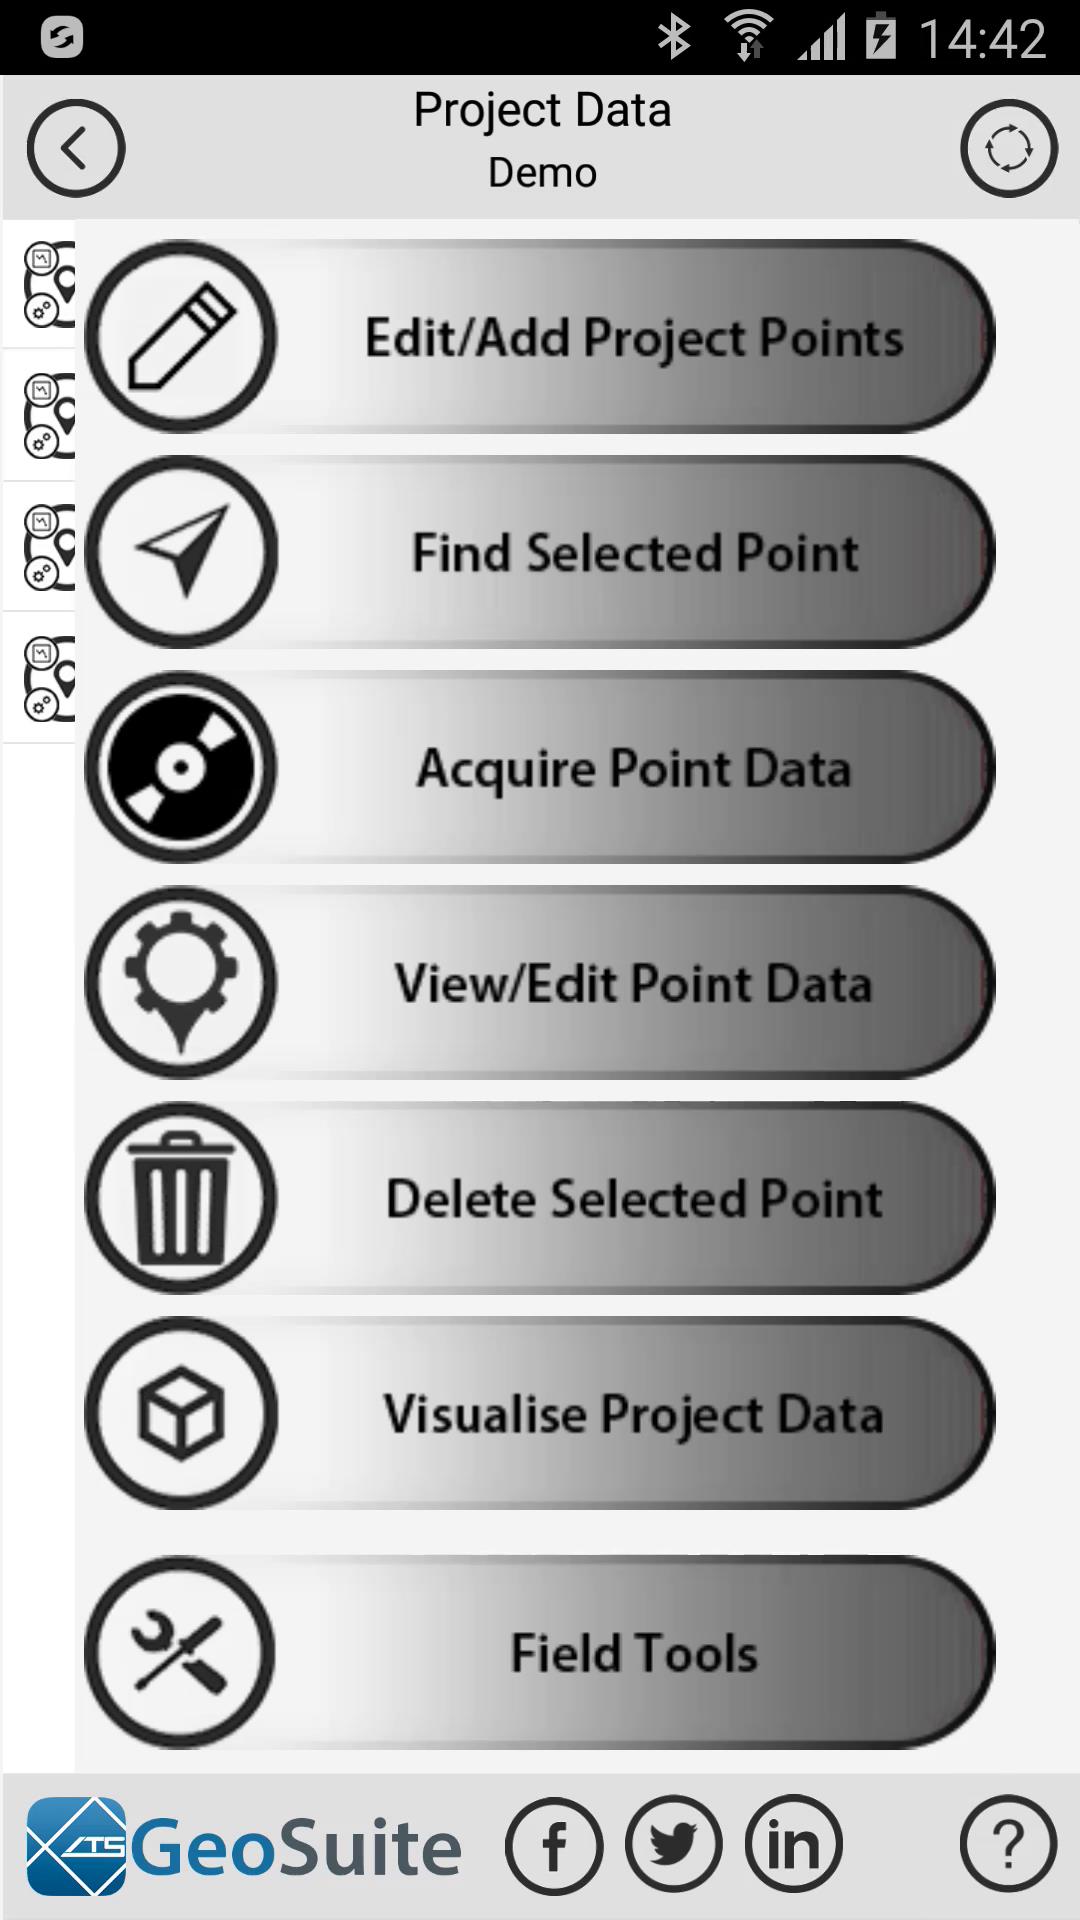
If the user would like to create a new point in the field that does not already exist on the list, then the list selection must be cleared before continuing. This is done by selecting the clear list selection option on the top right of the "Project Data" menu. This will clear the project point list selection as shown below.

If no points have been created or if the point of interest does not exist on the list, simply leave the point un-selected and a point will be created for the survey location in the next step.
Select the "Acquire Point Data" option from the Project Data menu. The full menu can be seen by left swiping the Project data options bar. Right swiping will close the full option menu.


The first step in the data acquisition process is to check if the cable is functioning correctly. Connect the cable to the device then join the two clips together as shown in the diagram. Once this is done, select the "Next" option to proceed.

A warning may appear about high volume levels. If it does simply select the "OK" option.

If the cable is tested to be in good working order, setup the survey point as illustrated. Place a seismic source plate directly above the location you wish to collect data at. Insert two steel or stainless steel electrode pins into the ground, exactly 2m apart, in an EAST/WEST direction. The pin closest to the seismic source plate should be no more than 20cm from the plate and no less than 10cm from the plate. Both electrodes must be inserted into the ground so that a good, firm, electrical connection is made between the ground and pin. The pins cannot be loose or wobbly to the touch. Generally speaking, 9 inch nails are perfect for most surveys, however, longer pins may be required if working on sandy soil types. Now connect the "Black" ground cable clip to the electrode pin nearest to the seismic source plate. The "Red" recording pin should be connected to the electrode pin furthest from the seismic source plate.
Lay the phone down, on a level surface, between the two electrodes such that the top and bottom of the phone points in a north/ south direction
When the survey setup is complete, select the "Next" Button to continue.

The survey location will then be analyzed for noise content and the soil resistivity will be determined.

Once the survey sites noise evaluation is complete, the data will be shown in the Point Noise Statistics Window on three charts:
- Background Noise Time Series - This data set shows three seconds of site background noise time series data. Any periodic or non-periodic noise will be visible on this chart. In the case of the chart below, non-periodic electric fence noise is shown on the chart for the site.
- Background Noise Frequency - This data set shows the frequency domain representation of the site noise recorded for a period of four seconds.
- Background Noise Statistics - This data set shows the site background periodic noise statistics as a set of predefined values sets, including:
- Fundamental power line noise frequency amplitude
- Power line noise odd harmonic group amplitude
- Power line noise even harmonic group amplitude
- High frequency group amplitude
- For all the above statistical data sets the following risk color grading applies:
- Red - High levels of noise detected (Usually considered as unacceptable
- Yellow - Medium level of noise detected (Usually considered as acceptable with risk)
- Green - Low level of noise detected (Considered as acceptable and low risk)

Snapshot Icon
A snapshot tool is available that allows the user to save images of the individual charts to the Documents directory on the device in PDF format.
To proceed, select the "Next" button to continue.

If the user accepts that the sites noise characteristics are of an acceptable level for the project, the equitation of data can begin. Simply lay the phone down between the two electrodes such that the top of the phone points in a north/ south direction.
If the user has determined that non-periodic noise is present on the site, then the user may choose to apply filter to attempt to remove the non-periodic noise from the data sets. This is done by activating the filters using the checkbox at the bottom of the "Acquire data" menu.
Warning - Applying these filters may cause loss of vertical resolution in the GeoSuite data sets. the user should only use these data sets when absolutely necessary.
Then press the "Start" label to start recording data.

Data will be collected within a 40 Second period. This time frame will be indicated by a countdown clock and must not be interrupted in any way for the duration of the 40 second recording. During this recording period, the user must strike the source plate with a sledge hammer or other appropriate impulse type seismic source, a minimum of 6 times or a maximum of 10 times.

Once the 40 second recording process is complete, a series of processing algorithms will analyses and process the data for geophysical data extraction.
Each step is fully automated, however, the progress of each step is shown
The processes performed are shown in order:
- The data is filtered
- The data noise is evaluated
- The Electra-magnetic data is evaluated
- The data is extracted
- The data is correlated
- Finally, the data is rendered


Note - If the device screen saver is set to a duration that is shorter than the time it took to complete the data acquisition, the device screen will immediately go to sleep after the the data acquisition process is complete. The reason for this is that the app disables the device screen sleep mode for the duration of the data acquisition process. Once complete, it with turn the screen sleep mode again. If the sleep timeout has already occurred, then the device screen will immediately turn off. Simply touch the screen to reactivate the device and app. This is part of the normal operation of the GeoSuite Application.
When all the data analysis is complete, It will be displayed in the "Point Data" menu. Everything relating to the raw, unprocessed data is viable in this menu.


If the data is acceptable to the user then the "Accept" option must be used to save the data to the project point.
